Data Quality on Kafka Streams with Apache Griffin
This post was originally published on Medium and moved here later. The diagram was added and the post updated during the move.
Data quality in a batch world is annoying but tractable. The table is sitting right there. Query it, count the nulls, compare today against yesterday, go fix whatever turns up.
Streams don’t work like that. Somebody’s producer starts sending an empty string where an integer used to be, and by the time anyone notices, that data has been through five consumers, landed in a couple of warehouses, and rolled up into a dashboard a director looked at this morning. There’s nothing left to go inspect.
So the checking has to happen while the data is still moving, which is a different problem. Apache Griffin is one of the few open source projects pointed directly at it.
What Griffin is
It came out of eBay, went into the Apache Incubator at the end of 2016, and graduated to a top level project last December. 0.5.0 landed in April and is what I’ve been running.
The model is define, measure, analyze. You describe what good data looks like, Griffin runs a job measuring your data against that description, and the metrics go somewhere you can watch them.
The thing worth knowing before anything else is that those jobs are Spark. Batch measures are Spark jobs and streaming measures are Spark Streaming jobs. That one decision drives most of what follows, including the parts you won’t like.
Two of the measure types matter for Kafka work.
Profiling looks at a single source and describes it. Counts, min and max, group by a column, anything you can say in SQL. You’re watching for the shape of the data to shift.
Accuracy takes two sources and a rule, and tells you how much of the first is faithfully represented in the second.
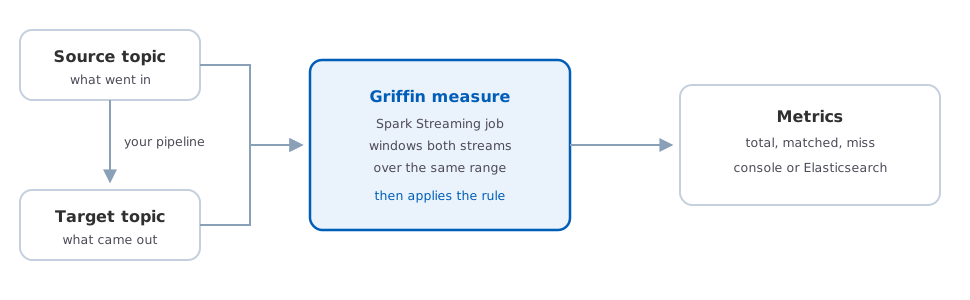
An accuracy measure across two topics. The interesting question is not whether the pipeline is running, it’s whether what came out matches what went in.
Say you have a pipeline reading topic A, doing something to the records, and writing topic B. Is the pipeline up? Your existing monitoring answers that fine. Did the pipeline quietly drop four percent of records for the last hour while staying green the entire time? It does not.
Two config files
Griffin splits its configuration in two. That confused me at first and then made sense once I had more than one measure running.
The environment config covers where things run. Spark settings, where metrics go, where Griffin keeps its own state.
{
  "spark": {
    "log.level": "WARN",
    "checkpoint.dir": "hdfs://localhost/test/griffin/cp",
    "batch.interval": "2s",
    "process.interval": "10s",
    "init.clear": true,
    "config": {
      "spark.master": "local[*]",
      "spark.task.maxFailures": 5,
      "spark.streaming.kafkaMaxRatePerPartition": 1000,
      "spark.streaming.concurrentJobs": 4
    }
  },
  "sinks": [
    {
      "type": "console",
      "config": { "max.log.lines": 100 }
    }
  ],
  "griffin.checkpoint": [
    {
      "type": "zk",
      "config": {
        "hosts": "localhost:2181",
        "namespace": "griffin/infocache",
        "lock.path": "lock",
        "mode": "persist"
      }
    }
  ]
}
There are two intervals in there and they are not the same thing. batch.interval is the
Spark Streaming micro batch. process.interval is how often Griffin actually computes a
measure. Small batches for collecting, longer stretches for measuring, since an accuracy
number recomputed every two seconds isn’t telling you anything.
The ZooKeeper block is Griffin’s own bookkeeping and it’s separate from Spark’s checkpointing. It tracks which time ranges have been collected and are ready to measure. You need both. They are not interchangeable, which took me longer to work out than I’d like.
The second file is the measure itself.
Profiling one topic
Start here. It’s the simpler thing and it catches more than you’d expect.
{
  "name": "prof_streaming",
  "process.type": "STREAMING",
  "data.sources": [
    {
      "name": "source",
      "connectors": [
        {
          "type": "KAFKA",
          "version": "0.8",
          "config": {
            "kafka.config": {
              "bootstrap.servers": "kafka:9092",
              "group.id": "griffin_prof",
              "auto.offset.reset": "smallest",
              "auto.commit.enable": "false"
            },
            "topics": "events",
            "key.type": "java.lang.String",
            "value.type": "java.lang.String"
          },
          "pre.proc": [
            {
              "dsl.type": "df-ops",
              "in.dataframe.name": "this",
              "out.dataframe.name": "s1",
              "rule": "from_json"
            },
            {
              "dsl.type": "spark-sql",
              "out.dataframe.name": "this",
              "rule": "select name, age from s1"
            }
          ]
        }
      ],
      "cache": {
        "file.path": "hdfs://localhost/griffin/streaming/dump/source",
        "info.path": "source",
        "ready.time.interval": "10s",
        "ready.time.delay": "0",
        "time.range": ["0", "0"]
      }
    }
  ],
  "evaluate.rule": {
    "rules": [
      {
        "dsl.type": "griffin-dsl",
        "dq.type": "PROFILING",
        "out.dataframe.name": "prof",
        "rule": "select count(name) as `cnt`, max(age) as `max`, min(age) as `min` from source",
        "out": [ { "type": "metric", "name": "prof" } ]
      }
    ]
  },
  "sinks": ["CONSOLE","ELASTICSEARCH"]
}
pre.proc is where the messages become something you can query. Griffin pulls strings
off the topic, from_json parses them, and a bit of Spark SQL projects out the fields you
want. this is a magic name for the current dataset, and your last pre-processing step
has to write back to it.
After that the rule is just SQL, which is the nice part of all this. Nobody has to learn a bespoke expression language to say count these and take the max of that.
The cache block is where the streaming semantics hide. Griffin dumps arriving records
to HDFS and measures across a time range, and ["0", "0"] means the current window and
nothing else.
Accuracy across two topics
Longer config, because you’re declaring two sources, but the part that matters is small.
{
  "evaluate.rule": {
    "rules": [
      {
        "dsl.type": "griffin-dsl",
        "dq.type": "ACCURACY",
        "out.dataframe.name": "accu",
        "rule": "source.name = target.name and source.age = target.age",
        "details": {
          "source": "source",
          "target": "target",
          "miss": "miss_count",
          "total": "total_count",
          "matched": "matched_count"
        },
        "out": [
          { "type": "metric", "name": "accu" },
          { "type": "record", "name": "missRecords" }
        ]
      }
    ]
  }
}
Three numbers come out. Total, matched, missed. And if you ask for it, the records that didn’t match, written out as records rather than metrics.
That last part is what makes this worth the trouble. Knowing four percent of your records went missing is the start of an investigation. Having the list of which ones is most of the investigation.
The source declares "baseline": true and its cache wants a range more like
["-2m", "0"]. That’s the concession streaming makes you make. Records don’t turn up in
both topics at the same instant, so you compare windows instead of moments, and the
window has to be wide enough to cover however far behind your pipeline runs without being
so wide that you keep re-measuring the same records. I did not get that right the first
time.
Where it gets rough
The Kafka connector in 0.5.0 supports 0.8. The docs say 1.0 and later is in progress. If you’re on a current broker you’ll be leaning on protocol compatibility, and that’s a conversation with whoever owns your brokers before it’s a data quality project.
Values have to be JSON strings. No Avro, no schema registry integration. Which is awkward, because the shops running Kafka seriously enough to want data quality tooling are frequently the same shops running Avro with a registry. You can write your own connector.
It’s also not a small thing to stand up. Spark, HDFS for the cache and checkpoints, ZooKeeper for Griffin’s state, Livy if you want the service submitting jobs for you, Elasticsearch for metrics, and a relational database for metadata. If you already run a Hadoop cluster then most of that is sitting there already and this is an afternoon. If you’re a Kafka and Kubernetes shop with no Spark anywhere, you’re being asked to adopt a whole stack in order to get some data quality checks.
Would I use it
If Spark and Hadoop are already in use, yes. The accuracy measure across two topics is genuinely useful and I don’t know of another open source project doing that as directly. Emitting the mismatched records instead of only a percentage is what makes it actionable rather than just alarming.
If that infrastructure isn’t there, think harder about what you’re actually trying to catch. A lot of what people mean by streaming data quality turns out to be schema enforcement, and a schema registry gets you that with a fraction of the machinery. Griffin earns its keep on the questions a schema can’t answer.
If you’re building out streaming pipelines and want to talk through where the checks should go, please reach out.